Here are step-by-step instructions how to reproduce the S3E-CCR experiment, described in:
Spin-state selection for increased confidence in cross-correlation rates measurements
P.R.Vasos, J.B.Hall, D.Fushman, JOURNAL OF BIOMOLECULAR NMR 31 (2): 149-154 FEB 2005
Click here to see a pdf version of the paper.
Theoretical analysis of the effect of miscalibrated pulses and delays, performed using the VSNMR software, is presented in detail in the Supplementary Material to our paper
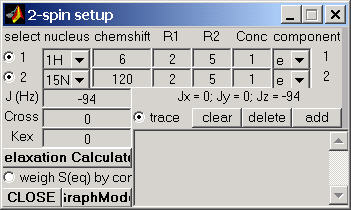
To start, select the spin system using Spin System Setup window. The example shown here selects the a and b components of a 15N-coupled spectrum for a pair of 1H and 15N nuclei, with a scalar coupling of -94 Hz. You can use the default values of spin-relaxation parameters and run the program to calculate the expectation values of several spin operators during the experiment:
Relaxation Calculator:
If you also want to take into account the differential line broadening effects
for different spin-doublet components, click on the Relaxation Calculator
button, select the desired dynamic parameters, and Calculate
relaxation rates. Then check out the R2-matrix button (as shown below) and
click on the Update button. For more details of how to use Relaxation
Calculator see the example of a
Fully coupled experiment with
spin-transition-specific linewidths .

Subsequently, in the spin setup window, the boxes for the individual R2 values contain the letter "M" (i.e. matrix) instead of numeric values
Pulse Program: Experiment A
Now let's go to the pulse program. Select the s3ec2r.pv pulse program. This pulse program includes the S3E element for spin-state selection and allows you to select which of the two 15N-doublet components you want to observe in the experiment. The latter is done by choosing a proper receiver phase cycle:
experiment A corresponds to selecting the upfield component, while
experiment B selects the downfield component.
Edit the receiver phase cycle line of the program so
that phase cycle "A" is selected (i.e. you have to uncomment the
the receiver phase cycle line labeled ";A". Make sure that the
receiver phase-cycle line labeled "B" is commented out!). The
relevant lines should read:
ph31= 0 2 2 0 ; A
;ph31= 0 2 2 0 ; B
Now click on Xlate button to translate the pulse program into
Matlab code.
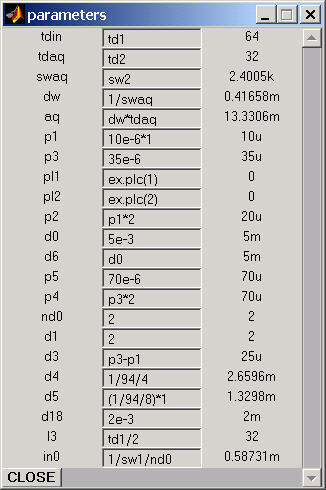
Check/Select the Program
Parameters as follows (nd0 should be preset to 2, d1 to 2s, d4 to 1/94/4,
which equals 1/(4J), and d5 to 1/94/8, which equals 1/(8J)):
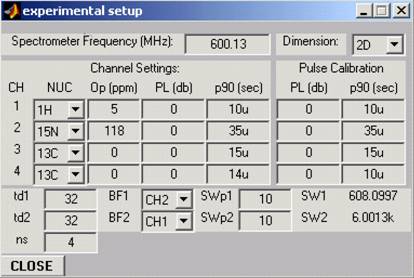
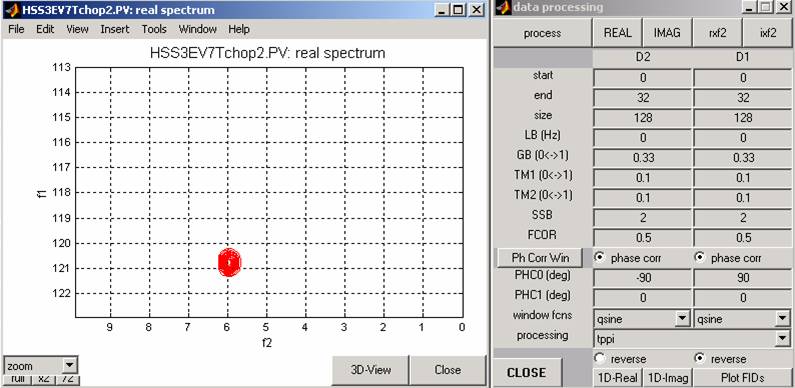
Experimental Parameters:
Op1=5, Op2=118, td1=32, td2=32,
ns=4, BF1=CH2, SWp1=10ppm SWp2=10ppm
Run the experiment.
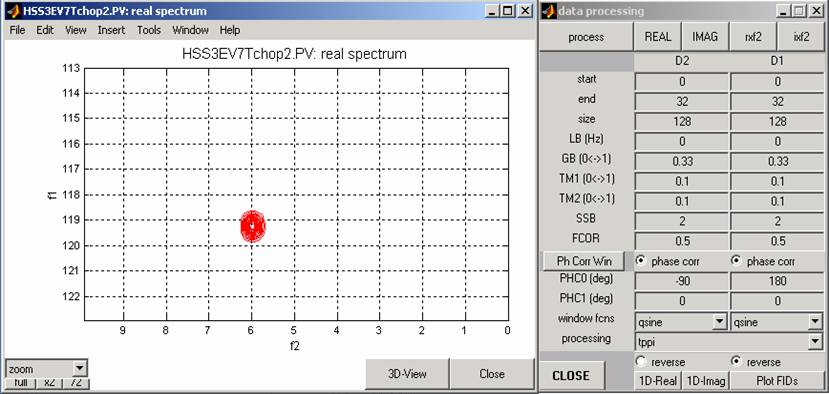
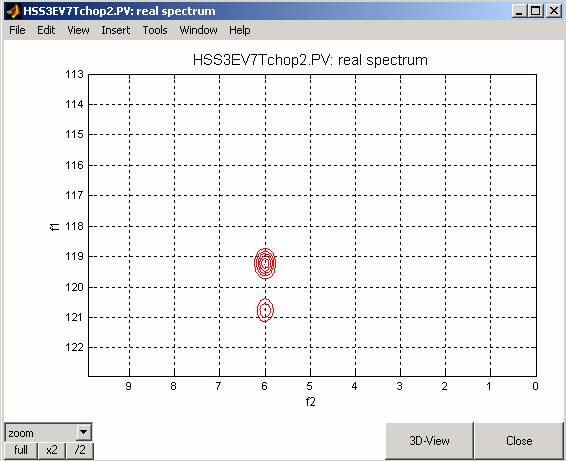
After processing, the spectrum for the A experiment, selecting the upfield component,
should look like the this (process using TPPI)
Pulse Program: Experiment B
Now edit the s3ec2r.pv pulse program again to
select the ";B" receiver phase cycle. Once again the relevant code
should be:
;ph31= 0 2 2 0 ; A
ph31= 0 0 2 2 ;B
Translate the pulse program again (you have to translate it every time you change the pulse program!), check that the program parameters are set as before, and then run the experiment. You do
not have to reset the spin system parameters or the experimental parameters --
they have to (and will) remain the same as in experiment A.
Once again save the B data set by typing at the command line:
serB=vs_runCalc.ser0;
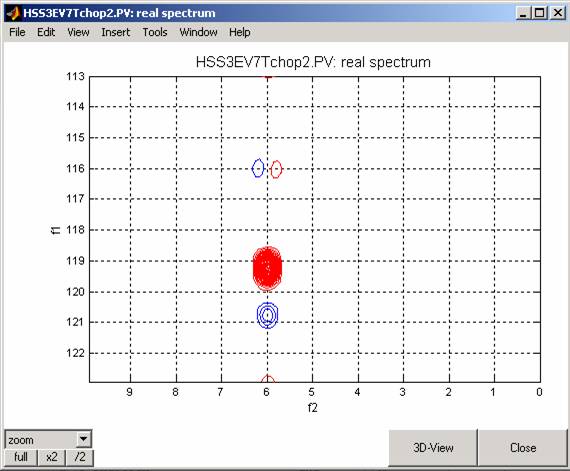
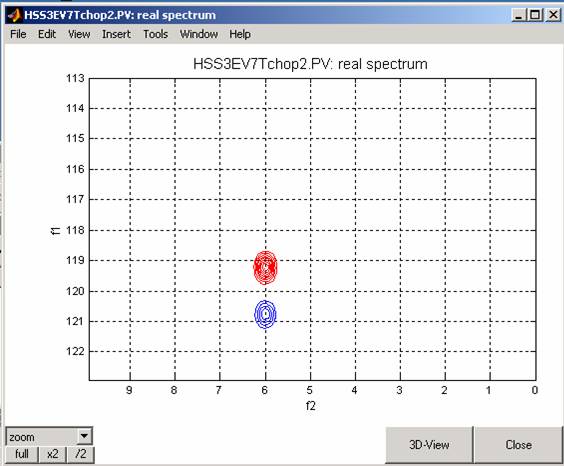
The processed spectrum from the B data set should look like the following (process
using TPPI:
Notice the 90º phase difference (taken into account in the processing parameters) between the upfield and downfield 15N components.
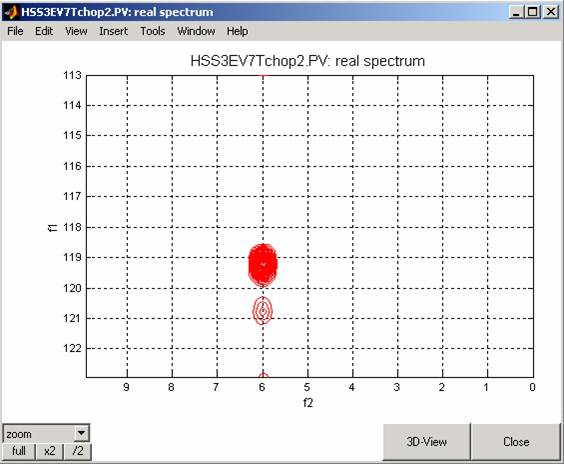
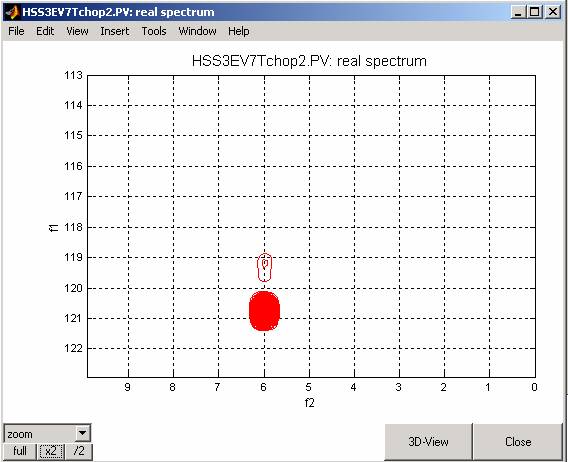
Now, going back and changing the pulse program to the experiment A
settings, modify the value of the "d5" delay in the program parameters, setting
it to (1/4/94)*1.1 and run the experiment again. This simulation mimics the case of delay missetting.
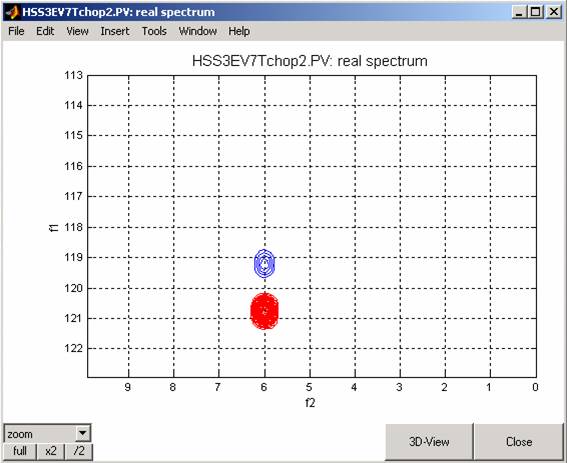
The spectrum will look like this:
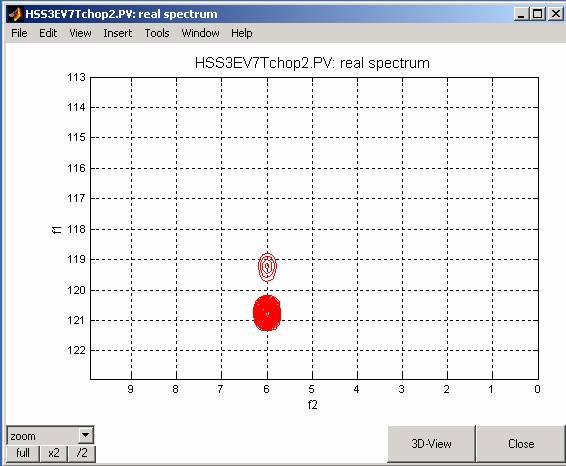
When the value of the d5 delay in the program parameters is set to d5=(1/4/94)*0.9 (i.e. shorter than the proper value) the spectrum will change to:
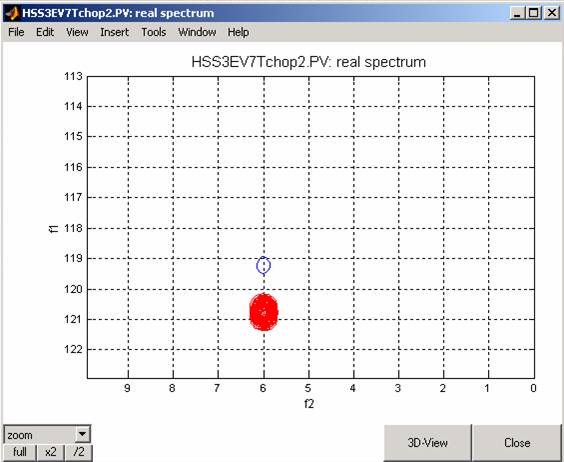
The same simulation, now with d5=1/4/94*0.9 gives the following spectrum:
We will now simulate the effect on the resulting spectrum due of the deviation from the ideal (calibrated) value in the length of the 15N 180º pulse in the middle of the selection period.
This pulse is denoted p5 in the pulse sequence. With the current experimental settings, the optimal (default) 15N 180º pulsewidth is 70us.
Set the selection delay d5 back to its optimal value (d5=1/4/94) and set p5=1.1*70us.
for the upfield-component-selection experiment (A), the spectrum looks like this:
Setting p5 to a shorter value: p5=0.9*70us, results in the following spectrum
The relative signs of the artifacts with respect to the main (observed) component change when selecting the lowfield component (expt B) is observed for the case p5=70us*1.1:
and for p5=70us*0.9:
Go Back to VNMR Tutorial Index
These instructions were prepared by Paul Vasos and David Fushman.
Last update 07/07/05.
(c) Copyright 2005 by David Fushman & Paul Vasos, University of Maryland